
Grafana is an open-source solution for analytics and monitoring, that supports multiple tools as data sources. This gives us the advantage to have dashboards that not only have CloudWatch metrics on it, but also metrics from other tools like Prometheus, Redshift, and much more.
Having said that, Grafana needs to be living somewhere: inside a server like an EC2 instance or deployed as a pod in Kubernetes. But these options come with the drawback that they need to be installed, configured, and maintained. If we want to quickly start creating our monitoring system, that will take us some time and effort.
This is where Amazon Managed Grafana comes in handy, which is a fully managed service for Grafana that can be integrated with AWS IAM Identity Center (successor to AWS SSO), in order to also provide the layer of authentication and authorization using our existing credentials for our AWS account.
In this blogarticle I’m going to explain how to deploy Amazon Managed Grafana, assuming an account with AWS IAM Identity Center is already enabled.
Creating a Grafana workspace in AWS
To begin, we login in our account from our AWS IAM Identity Center page, which would be looking something like:

Then search for Grafana and click on “Create workspace”.

Write the name of the workspace, and optionally a description and tags (which can be used for billing purposes for example).

Next step is to click on “AWS IAM Identity Center” and we leave the rest with the default values for this example.

Then choose Amazon CloudWatch as data source in order for AWS to create a role with the necessary permission to query it. Here we could choose other AWS sources as data sources, depending on our use case. And besides that, we will also enable AWS SNS as a notification channel.

Review the details and click on “Create workspace”.

Wait until the workspace is created and the result should be something like this:

Notice that AWS will automatically create an URL which we can use to access Grafana. It is also possible to see the role that has all the necessary permissions to access the data sources that we previously chose. Keep in mind that the URL will be deleted once we also delete our workspace.
User management
Amazon Managed Grafana supports 3 types of user roles: Admin, Editor and Viewer. For more information about the differences, click the link to the official documentation.
For this example, I will add my user as administrator of the workspace and a group as viewer. In order to do so, we will click on “Assign new user or group” as shown in the previous image.
Then on “Users” we will search for the user and on “Groups” for the group. After that we click on “Assign users and groups”. The Viewer type will be given by default.

Now select the user, click on “Action” and then “Make admin”.

Following we will have our Admin user and Viewer group like this:

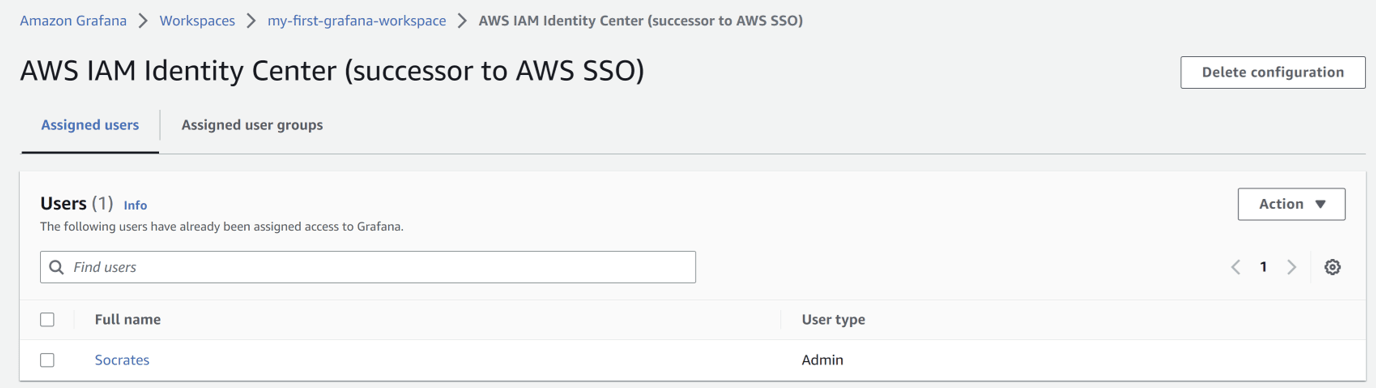
Anyone who is part of that group, and the admin user can then access Grafana from the URL we previously saw, or by opening again our AWS IAM Identity Center page, which will look like this:

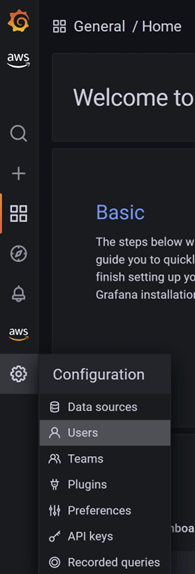
With the admin user, we can go to “Configuration -> Users” to see all the users already using our workspace.
This completes the first configuration of user and groups. One thing to remember is, that the roles configured for the users and groups will be applied for the entire workspace, which means that by default, any user of the above group can view any dashboard inside the workspace.

If we have multiple groups which should have different roles, of course we can create multiple workspaces for each of them, but this wouldn’t be cost effective most of times. For the sake of sharing one single workspace, having multiple teams, and assigning different permission to them inside Grafana, we need to do the following: Go to “Configuration -> Teams -> New team”.

Name the team, also mentioning which role the team has.

Even though my user is Admin already, for this example I will still add it as a team member. Therefore, click on the team we just created, look for the user and then click on “Add to team”.

After that, we can create all the necessary teams, also adding their members as soon as they log in (they will not appear until then). For example, we can have something like this:

Folder structure
Now we need to create this structure, so each team can use the workspace without affecting each other by mistake.
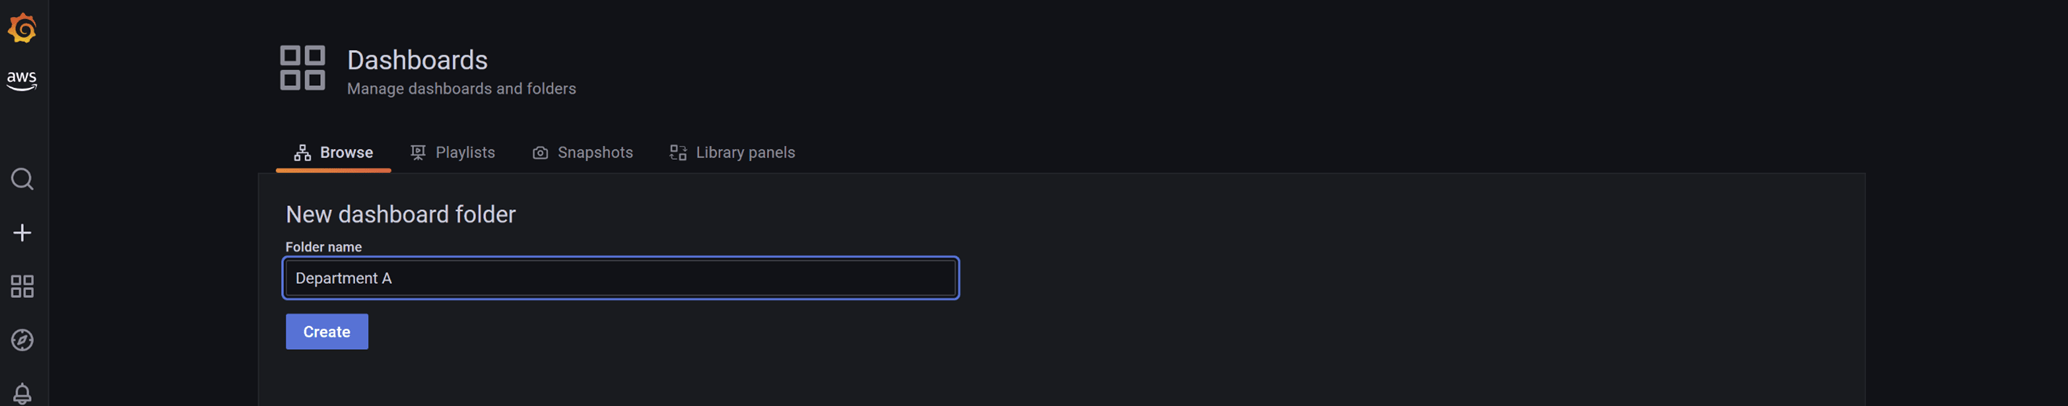
Go to “Dashboards -> Browse”.

Click on “New Folder”.

Name the dashboard and click on “Create”.
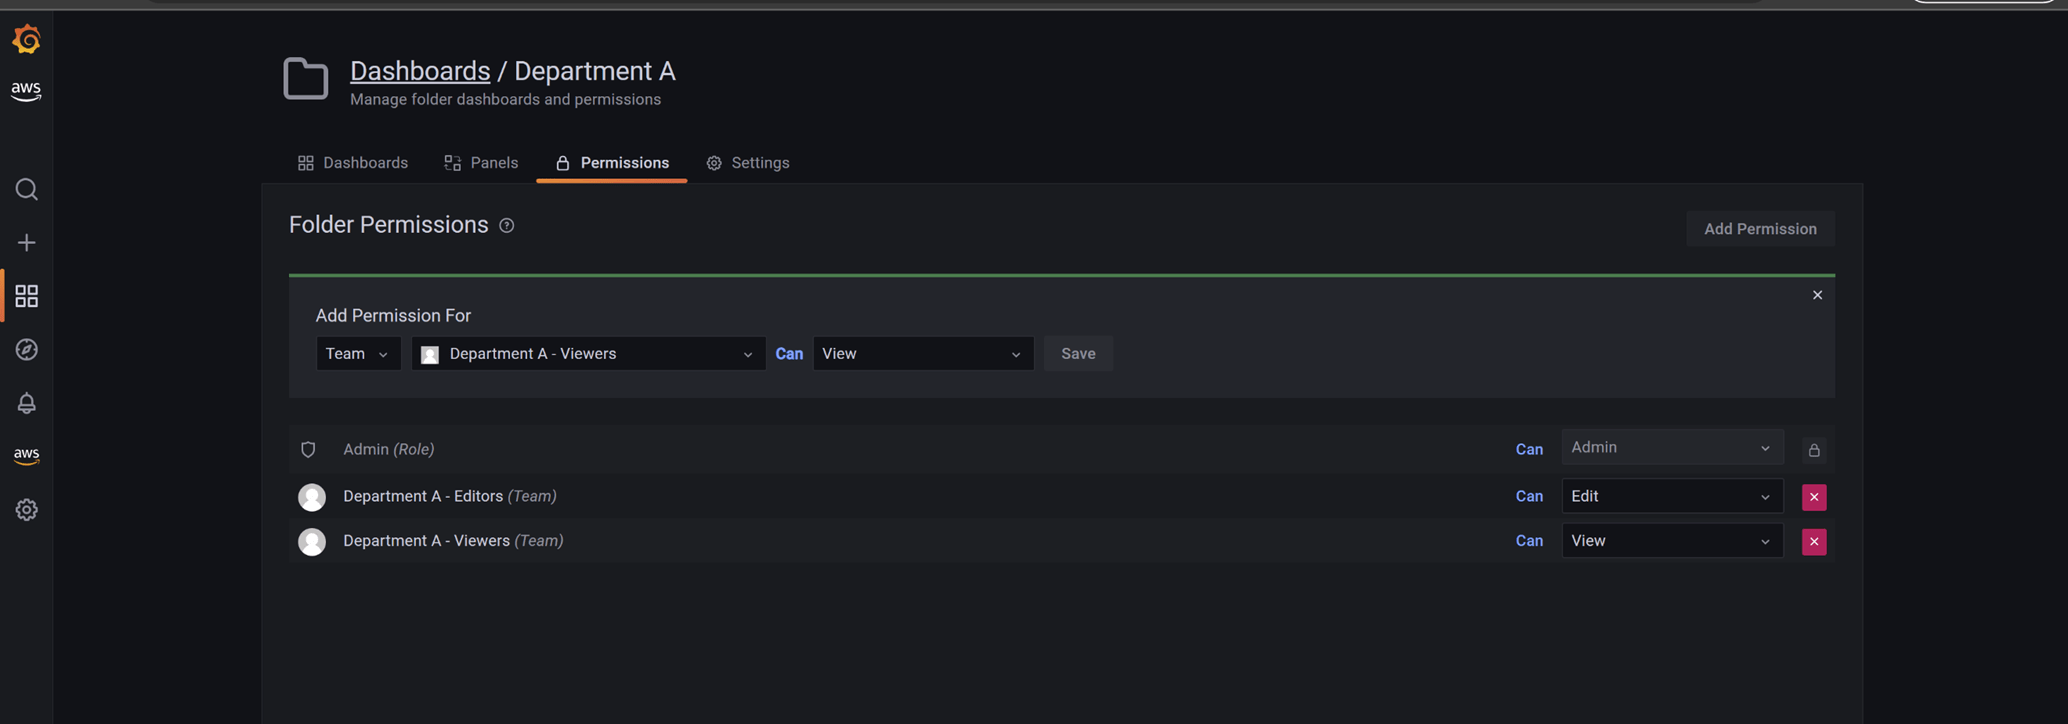
Next go to “Permissions”.

Delete Editor and Viewer permissions that are there by default, clicking the red “X button”.

Now select “Add Permission”, choose the team that should have access to that folder with the necessary permission. After adding all necessary teams, it will look like this:
Repeat all the steps from the creation of the folder for all the other teams and then we will finally have a workspace that can be shared among different teams.
Where are my metrics?
With this approach, we can also have shared data sources or also restrict the access of the data sources by team. In this example we will add CloudWatch.
Go to “Configuration -> Data Sources” -> Click on “Add data source”.

Search for “CloudWatch” and click on it. Leave all fields with the default values they currently have and click on “Save & test”.

After that, CloudWatch will be available for all the teams. If you would want to restrict the access, we would go to “Permissions” and add only the teams that can use it.
You have done it!
Now our teams can finally start creating their dashboards and our structure would look like the following:

Next steps
We have deployed a workspace with mostly choosing all default configuration values. Amazon Managed Grafana still provides so much more features that we can use to protect our workspace, the data sources it can access, notifications that can be sent based on a metric, among others.
I hope this information is useful and that this base can help your teams to quickly have a tool to monitor their AWS Services, infrastructure, and applications.

