
Today’s change in technological and methodological developments to Cloud Computing, Continuous Integration/ Continuous Delivery (CI/CD) and DevOps – together with the shift from monolithic to lightweight micro-service architecture pattern, is enabling organisations to speed up development and deployment production applications.
A paradigm shift that also comes with shortcomings. Distributed logs, including the proliferation of instances and containers, are making log management and monitoring much more of a challenge. Not only sheer the volume of interconnected data points across modularised/ distributed systems is to be considered. Moreover, the structured and semi-structured log data entails being parsed, normalised and analysed in real-time. As micro-services run on multiple hosts, log messages generated by micro-services are spread across multiple servers – making it exceed human abilities to find valuable information or permit tracking errors to their source for correction, amidst many logs files (without even mentioning auto-scaled environments). In many ways, organisations embarking on the journey to this paradigm shift – successful development and operations comes down to successful Log Management to grant full visibility into the health of micro-service environments and fulfil logging and monitoring requirements for compliance.
What is Log Data?
Logs or log files can be described as the lingua franca of a computer system, software and other network apparatus emitted in response to an event occurring within a system or network.
In general, a log file consists of 3 attributes:
- Timestamp – the time and date the message was generated.
- Source system – the apparatus creating the log file.
- Log message – the actual log data.
NIST[1] categorises log events in 3 types: security software-, operating system- and application logs. Yet, there is no standardisation on the extension of the log files or the schema of the log data i.e. content, format, or severity – leading to each system, application or network generating different log files in different formats.
Getting Insights from Log Data
Central Log Management is critical and essential when organisations become steeped in the mindset of moving towards Cloud Computing and light-weight micro-service architectures. First and foremost, a holistic view of log data generated across the enterprise infrastructure eliminates the complexity and is much more powerful than analysing log data in isolation. Per contra, ingestion log data from different source points is leading up to implications arising by non-standardisation, which makes it exceptionally hard or even infeasible to analyse log events side-by-side without a tool. A Log Management solution is required to centralise, correlate and analyse all log files, to ensure that data hidden in logs are turned into meaningful, actionable insights. Besides a centralised log management solution, also a systematic and comprehensive approach is required to be able to analyse log data from the entire infrastructure stack. Typical use cases facilitated by centralised log management solutions are:
Real-time Monitoring and Troubleshooting: The accumulation of all performance and error log data in one central location and making it accessible to authorised users plays a crucial role in reducing MTTR (mean-time-to-recovery) through time-efficient and proactive monitoring and breaking down the barriers between IT Ops and developers. Automated monitoring and issue troubleshooting help to assure application and infrastructure health by tailing logs in real-time to pinpoint and alert on operational problems to further drill-down to find the root cause of the issue.
Event Correlation: A powerful analysis technique that allows drawing complex relations from various log events into identifiable patterns. If those identified patterns indicate anomalies – automated actions (i.e. alerts or alarms) based on defined conditions and rules can be performed to achieve a streamlined in-depth control. Event correlation is typically used to identify indicators of an attack to enhance security and enable security professionals to detect and alert on threats.
Compliance and Regulations: After all, not only the rapidly evolving technology landscape has reinforced the need for a log management solution. Security and compliance regulations mandate organisations to collect, retain and protect log data and provide its availability for auditing e.g. PCI DSS, ISO 27002 or GDPR.
Despite COVID-19 hitting enterprise wallets – the demand for Log Management solutions is still anticipated to grow. Data Insights is a holistic solution integrator with extensive expertise in Log Management. In the following – it will be demonstrated how to install Graylog in AWS on an Ubuntu 20.04 LTS machine.
Graylog as Central Log Management Solution
Graylog is a powerful open-source enterprise-grade log management system solution, providing an integrated platform for the collection, storage, normalisation, search, analysis and visualisation of log data from across the entire IT infrastructure and application stack on a centralised server. The software operates on a three-tier architecture and scalable storage – built around Elasticsearch and MongoDB.
The minimum system setup consists of the Graylog web interface, Graylog server, Elasticsearch nodes to store log data and provide search capabilities to Graylog, and MongoDB to store configuration data.

Source: Graylog
Guide: How to Deploy Graylog in AWS (Ubuntu 20.04 LTS)
So, here we go. This brief tutorial takes you step-by-step through the process of installing a Graylog server in AWS on a clean Ubuntu 20.04 LTS machine, and the configuration of a simple input that receives system logs.
- Step 1: Deploy Ubuntu 20.04 LTS server in AWS
- Step 2: Install OpenJDK, MongoDB, Elasticsearch
- Step 3: Install Graylog
- Step 4: Setup Syslog Input
Note: This tutorial does not cover security settings! Make sure the Graylog server is not publicly exposed, and (enterprise) security best practices and guidelines are followed.
Step 1: Deploy Ubuntu 20.04 LTS machine in AWS
- Launch an EC2 instance
Log in the AWS console and in the top navigation bar – go to > Services > EC2 > Choose Amazon Machine Image (AMI)
Select > Ubuntu Server 20.04 LTS (HVM), SSD Volume Type
- Choose an Instance Type
Graylog requires at least4GBmemory – depending on the data volume intended to be collected RAM is to be increased
- Finish configuration wizard and spin up the Virtual Machine (VM)
Note: Add Storage – In this tutorial, we are only doing a basic setup with our VM’s syslog input.
Optional: If you aim to configure more inputs, increase the disk storage to at least40GB.
Go to >Launch
Choose > Create a new pair, save .pem file locally and select > Launch instances - Configure Security Group
Once the instance is launched click on the newly launched instance the instance overview page. In the description section, select to the default security group that has been launched by the configuration wizard. Open ports:9000, 514, 1514(Select > Source > Anywhere)
- Allocate Elastic IP address
In the navigation pane – go to > Elastic IPs
Select > Allocate new address > Amazons pool (IPv4 address pool) > Allocate
Go to > Actions > Associate address
Select >launched_instance> Associate - SSH to launched AWS instance as Ubuntu user
In the EC2 instance overview dashboard, select thelaunched_instanceand go to > Connect – and follow the terminal instructions. - Update Ubuntu machine
To update the Ubuntu machine run the following commands below:sudo apt-get update sudo apt-get upgrade
When prompted enter y
Step 2: Install OpenJDK, MongoDB and Elasticsearch
Since Elasticsearch is a Java-based software – a prerequisite to run Elasticsearch is the installation of Java.
OpenJDK Installation
To install the open-source version of Java – run the following commands below:
sudo apt-get update && sudo apt-get upgrade
sudo apt-get install apt-transport-https openjdk-8-jre-headless uuid-runtime pwgen
When prompted enter y
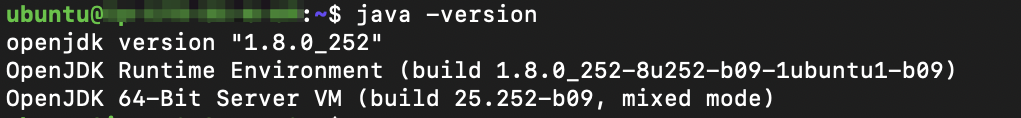
To verify the Java installation – run the following command below:
java -version
The output should be similar as below:
MongoDB Installation
To install MongoDB – run the commands below:
sudo apt-key adv --keyserver hkp://keyserver.ubuntu.com:80 --recv 9DA31620334BD75D9DCB49F368818C72E52529D4
echo "deb [ arch=amd64 ] https://repo.mongodb.org/apt/ubuntu bionic/mongodb-org/4.0 multiverse" | sudo tee /etc/apt/sources.list.d/mongodb-org-4.0.list
sudo apt-get update
sudo apt-get install -y mongodb-org
To enable MongoDB automatically during the operating system’s startup and verify it is running – run the commands below:
sudo systemctl daemon-reload
sudo systemctl enable mongod.service
sudo systemctl restart mongod.service
sudo systemctl --type=service --state=active | grep mongod
sudo systemctl status mongod
The output should be similar as below:

Elasticsearch Installation
To install the open-source version of Elasticsearch 6.x – run the commands below:
wget -q https://artifacts.elastic.co/GPG-KEY-elasticsearch -O myKey
sudo apt-key add myKey
echo "deb https://artifacts.elastic.co/packages/oss-6.x/apt stable main" | sudo tee -a /etc/apt/sources.list.d/elastic-6.x.list
sudo apt-get update && sudo apt-get install elasticsearch-oss
To modify the Elasticsearch config file – run the command below:
sudo tee -a /etc/elasticsearch/elasticsearch.yml > /dev/null <<EOT
cluster.name: graylog
action.auto_create_index: false
EOT
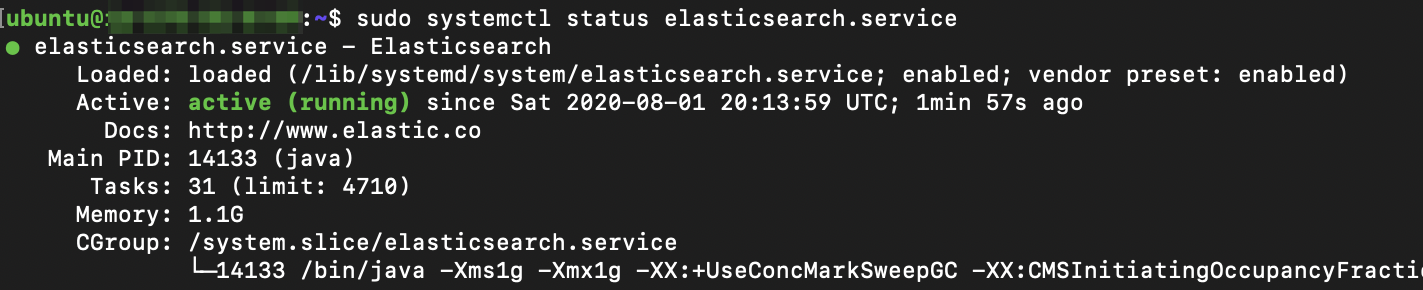
To start Elasticsearch and verify it is running – run the commands below:
sudo systemctl daemon-reload
sudo systemctl enable elasticsearch.service
sudo systemctl restart elasticsearch.service
sudo systemctl --type=service --state=active | grep elasticsearch
sudo systemctl status elasticsearch.service
The output should be similar as below:
Step 3: Graylog Installation
By now, Java, Elasticsearch and MongoDB are installed and configured.
To install the Graylog repository configuration and Graylog itself – run the commands below:
wget https://packages.graylog2.org/repo/packages/graylog-3.3-repository_latest.deb
sudo dpkg -i graylog-3.3-repository_latest.deb
sudo apt-get update && sudo apt-get install graylog-server graylog-enterprise-plugins graylog-integrations-plugins graylog-enterprise-integrations-plugins
Configure Graylog
To generate a secret key (administrator account password) of at least 64 characters – run the command below: <pre>
pwgen -N 1 -s 96
To set a hash (sha256) password for the root user – copy the generated secret key and create its sha256 checksum – run the command below (replace password with the previously generated password):
echo -n secret_key | sha256sum
To open Graylog config file – run the command below:
sudo nano /etc/graylog/server/server.conf
Replace password_secret (secret_key) and root_password_sha2 with the values previously created values.
Uncomment http_bind_address 9000. Save and exit the editor.
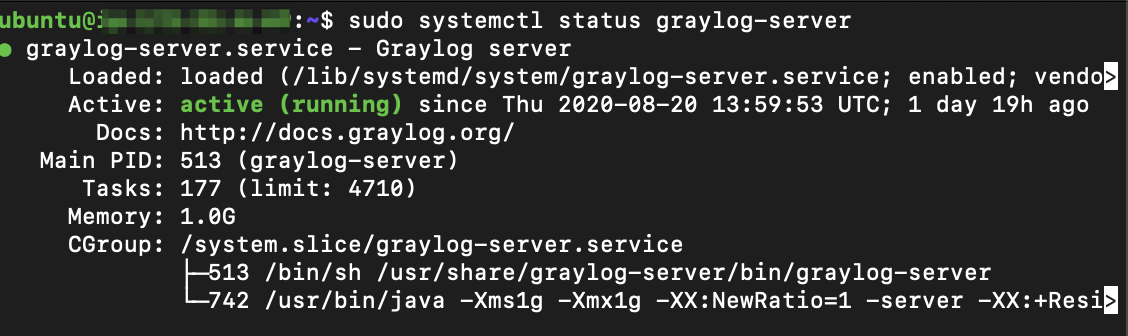
To restart Graylog, enforce it on the server startup and verify Graylog is running – run the commands below:
sudo systemctl daemon-reload
sudo systemctl enable graylog-server.service
sudo systemctl start graylog-server.service
sudo systemctl --type=service --state=active | grep graylog
sudo systemctl status graylog-server
The output should be similar as below:
Login to Graylog
In your local browser enter http:// and the Ubuntu’s server public IP address (as defined in the configuration file) followed by 9000 (port number). Now, you should be able to see the Graylog server portal. Next – log in as a default admin – with the previously generated password_secret (as defined in the configuration file).

Step 4: Setup Syslog Input
Graylog nodes process log data via Inputs. Therefore, the Input needs to be configured in the Graylog UI and in the server config.
Graylog UI Configuration
To setup or terminate inputs go to System > Inputs (in the Graylog UI).

In the dropdown box that contains the text Select Input, select > Syslog UDP, and then click > Launch new input. A form appears to fill in the following attributes:
- Node: Choose the deployed Ubuntu server (Private IP – should be the only option in the dropdown list)
- Title: Fill-in an appropriate name- i.e.
Linux Server Logs. - Bind address: Set it to the server’s private IP.
Note: To collect log data from external servers (not recommended – Syslog does not support authentication) bind address is to be set to0.0.0.0. - Port, enter
1514.
Note: Ports0through1024can be only used by the root user. Any port number above1024should be working as long no conflict is caused by other services.
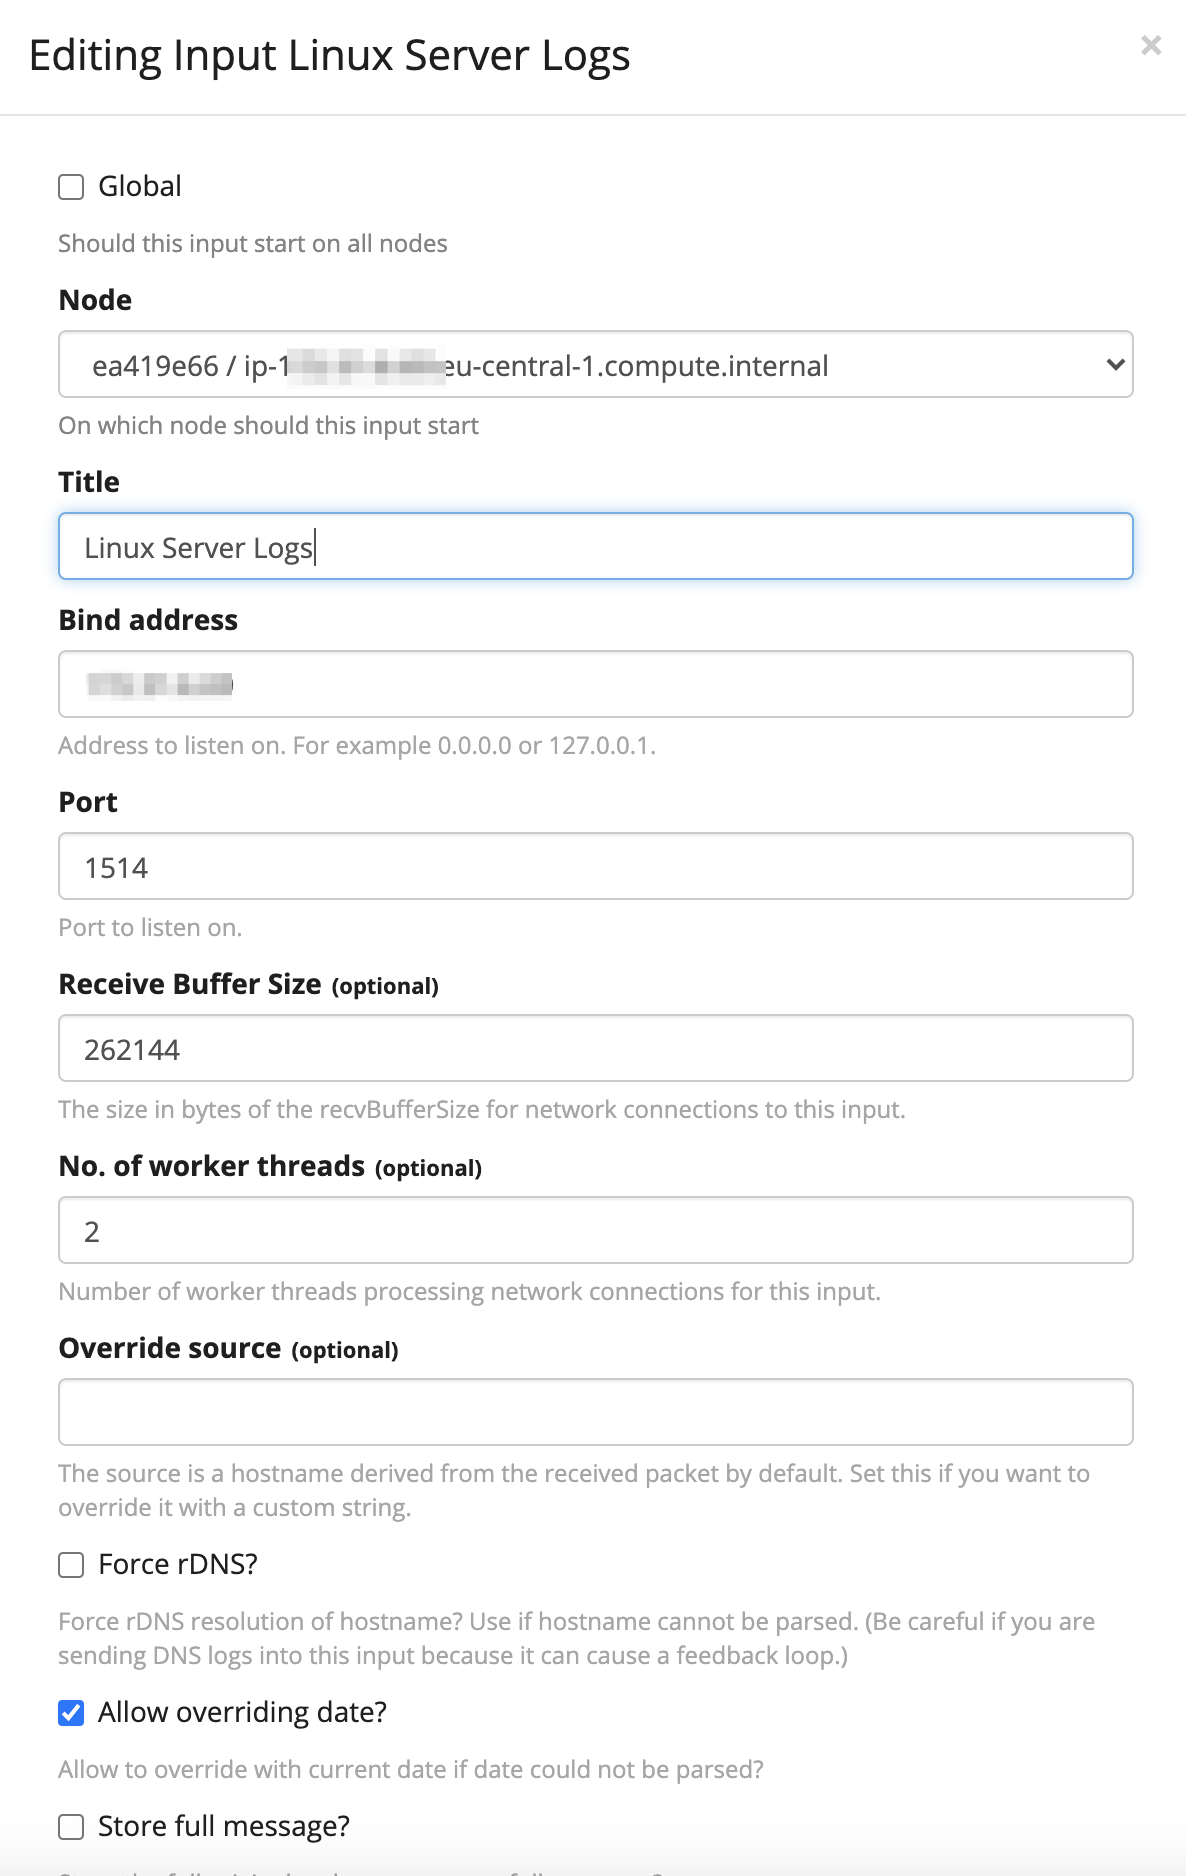
- Click > Save
So, far we configured an input that listens on port 1514. Next, the server needs to be configured to send the log data to Graylog.
Server Configuration
To create and open a new rsyslog configuration file – run the command below:
sudo nano /etc/rsyslog.d/60-graylog.conf
Note: To send logs to Graylog from other servers, the firewall exception for UDP port needs to be added first for the defined port e.g. 2514
sudo ufw allow 2514/udp
Add the line below to the rsyslog configuration file – replace private_ip with the Graylog server’s private IP. Save and exit the editor.
*.* @private_ip:1514;RSYSLOG_SyslogProtocol23Format
To restart rsyslog – run the command below:
sudo systemctl restart rsyslog
This step is to be repeated for each server to be sending logs to Graylog.
Go to > Search tab in the navigation bar in the Graylog UI. The most recent logs are shown there.

Conclusion
This guide showed how to deploy Graylog on Ubuntu 20.04 LTS in AWS and how to configure a straightforward input source. Next steps are:
- Finish setup in Graylog: Streams, extractors, dashboards, conditions and alerts.
- Protect log data: authorization concept, role-based access control, encryption, security settings, etc.
- Implementation of data log management lifecycle policies i.e. deletion, archiving, aggregation of log data (to avoid storage demand explosions
More information on Graylog and its documentation are to be found here.
Literature
[1] NIST https://nvlpubs.nist.gov/
[2] Graylog https://docs.graylog.org/en/3.3/

