
With the COVID-19 outbreak in full steam across Europe, it’s scary not knowing just how bad things will get. However, some other countries, such as China and South Korea, have began recording fewer new cases each day. This is an indication that the virus has (hopefully!) run its course in these countries.
But in Germany, the cases are still increasing roughly linearly. Is there any way to know the date, and infected number, at which the cases will peak?
The answer is…maybe? Predicting the spread of a virus is a huge task, and different populations, densities, climates, medical systems, and hygiene measures (and a million other variables) will create drastically different trends from one country to the next.
But perhaps a bad estimate is better than no estimate?
With that in mind, we decided to take a stab at it. We used Databricks to play with the COVID-19 datasets made available by Johns Hopkins University: https://github.com/CSSEGISandData/COVID-19
The idea is to model the case numbers in a country that has already peaked, and then project them onto Germany. The issue is that very few countries have peaked. However, South Korea is one country in which the number of new cases is on the decrease. Here is the current data as of March 10th, 2020:
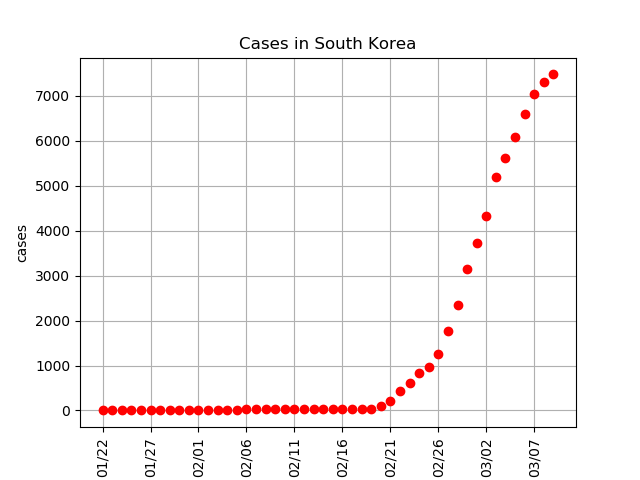
Although China also seems to be peaking in cases, South Korea has a similar population to Germany (51 million vs 83 million) and a similar HDI (9.0 vs 9.4). The idea will be to fit a Logistic Curve to this data. For the motivation behind why we should use a Logistic Curve, see here: https://www.youtube.com/watch?v=Kas0tIxDvrg
Note: Besides population and HDI, South Korea and Germany are completely different in many other ways. Fresh outbreaks are also always possible, so it’s impossible to be sure of these estimates. With hundreds of variables, the error bars are enormous. Please take this to be a pet project, as opposed to a realistic forecast.
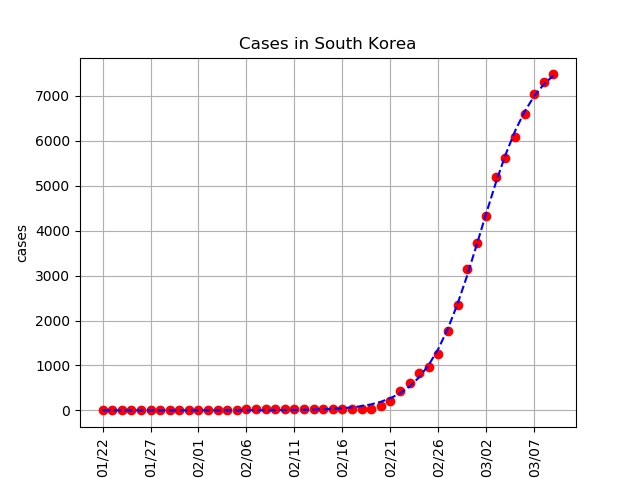
So here is our fit, which captures the initial exponential growth, and the eventual plateauing (when the virus has been contained). Now let’s take a look at Germany’s case numbers.
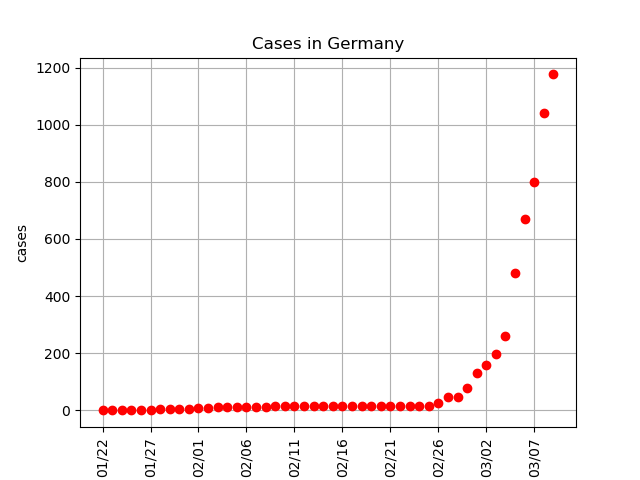
In Germany, the cases don’t seem to have slowed down yet. To get a rough estimate of when we expect this to happen, we take the fit generated on the South Korea data, and try to re-fit it to the German data. However (and this is the crucial part), although we allow the function to shift left-right (representing a different starting data), and stretch up-down (representing different numbers in maximum cases), we don’t let the function steepness change (we assume the behaviour of the infections, even if different, will still play out in a similar manner between these two countries). If you look at the definition of the Logistic Function (https://en.wikipedia.org/wiki/Logistic_function) this is the steepness of the curve (given by the variable k).
Applying this, we arrive at the following:

So if our assumptions hold (which, again, they very likely won’t!) we expect Germany to plateau at around 2600 cases in roughly 2 weeks.
So all that’s left to do is keep washing our hands, and see how well we did!
Thanks to Databricks for providing the framework, and Johns Hopkins for providing the data! Feel free to play with (and hopefully improve!) our methodology by checking out the GitHub repository: https://github.com/DataInsightsGmbH/Covid-19

